Quantitative trading analysis — without being a quant.
darwintIQ analyses the market the way institutional trading desks do — testing thousands of trading approaches against live market data — and shows you, in plain language, what's working right now and what isn't.
Get the data edge of institutional traders — no quant team, no code.
See what's actually working in the market right now, in plain language.
Analysis that adapts as the market changes — not static backtests from six months ago.

Meet Charlie
Charlie turns live model context into readable market interpretation.
Instead of stitching together rankings, signal state, and regime panels yourself, Charlie explains what the current market structure actually means. You get a structured read on tone, dominant regime, risk, and where conviction looks solid or fragile.
Read the market faster
Charlie turns live model context into a desk-style market brief instead of leaving you with raw metrics alone.
Understand what the structure means
See whether the current setup looks constructive, rotational, fresh, mature, or fragile in plain language.
Focus on the real caveat
Get the dominant structure and the main risk without having to interpret every panel yourself.
Controlled preview only. Full interactive Charlie is available inside the 14-day Pro Trial.
Read the Charlie docsMarket Briefing
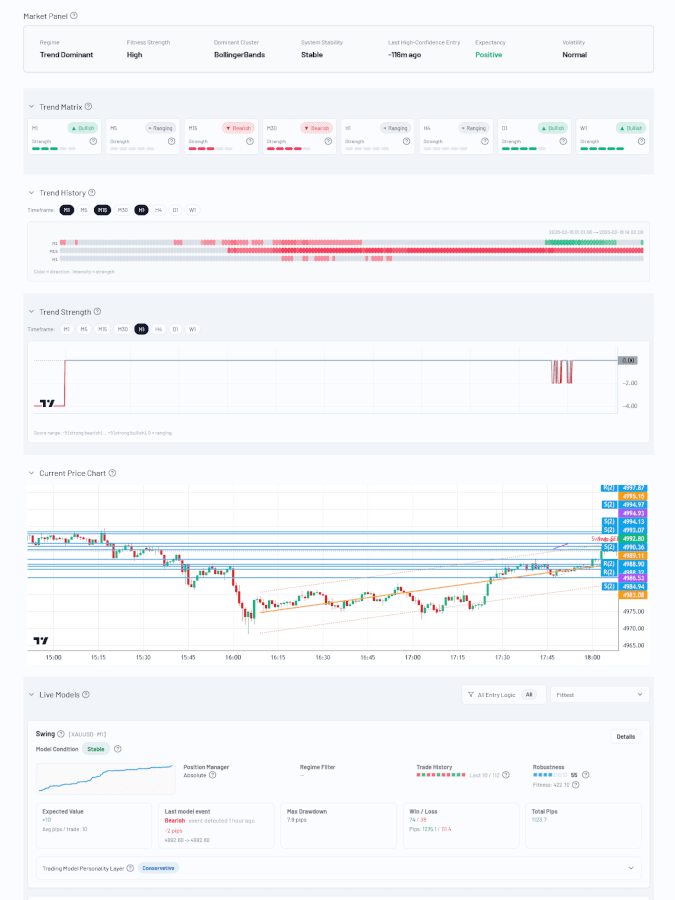
EURUSD still reads constructively intraday, but Charlie would frame the move as orderly rather than euphoric. The short-term structure is supportive, while the broader backdrop remains a useful counterweight rather than a full confirmation.
What stands out is the quality of the alignment. The move does not just look strong on one isolated read; it looks coherent across the shorter intraday layers, which usually matters more than a single metric flashing green.
The caution is that the broader backdrop has not fully rolled over into the same tone. That does not invalidate the bullish read, but it does mean Charlie would describe the environment as constructive and usable rather than fully one-sided.
Explore full market interpretation with interactive Charlie in the 14-day Pro Trial.
Start your 14-day Pro TrialTransparent — and simpler than it sounds
How darwintIQ works
darwintIQ continuously tests thousands of trading approaches against fresh market data, ranks them by how well they're working right now, and turns the result into a clear view you can actually read.
- 01
Thousands of trading approaches
darwintIQ builds and tests a large pool of trading approaches — different ways of reacting to the market. You don't build any of them; the system generates and manages them for you.
- 02
Continuously tested on live data
Each approach is re-tested on the latest market data, so you're always looking at how it holds up under current conditions — not at results optimised for the past.
- 03
Ranked by what's working now
Approaches are ranked by how robust and consistent they are in the current market. What rises to the top is what fits today — not what worked six months ago.
- 04
Turned into a clear market read
The result is a live, readable view of what's working, how the market is shifting, and where conditions may be changing — no quant background required.
Analysis only — darwintIQ does not execute trades.

Quant analysis, made accessible
What you get with darwintIQ
darwintIQ gives you a plain-language, quantitative view of what's working in the market right now — the kind of analysis institutional desks rely on, without the team, the code, or the jargon.
Always in tune with the current market
darwintIQ keeps re-evaluating trading approaches on fresh data, so you focus on what's relevant now instead of logic shaped by markets that have already moved on.
Learn more ->
Grounded in fresh data, not the past
Approaches are tested on recent market data in rolling windows. That gives you a realistic picture of what's holding up today — not a strategy polished to look perfect on old history.
Learn more ->
Data, not hype
No bold promises, no black boxes. You see measurable behaviour, live results, and the context you need to judge what's actually happening for yourself.
Learn more ->
Fits into your own workflow
Prefer to automate? Connect darwintIQ through the API and use the analysis inside your own tools, bots, or MetaTrader-based setup.
Learn more ->Built by a trader
I built the quant analyst I always wanted access to.
I'm a retail trader and software engineer. I kept watching promising trading approaches go from working to broken as the market shifted — and realised the tools that actually adapt in real time were basically locked behind institutional quant desks.
So I built one that isn't. Under the hood, darwintIQ runs a genetic algorithm that continuously tests and re-selects thousands of trading approaches against fresh market data — the way evolution works. Strong approaches survive, weak ones drop out. What you see is what actually fits the market right now, explained in plain language.
darwintIQ is the tool I built because I needed it myself. If you've ever wanted the data edge of the professionals without a quant team behind you — this is for you.
I don't hide. Find the code, the demos, and the conversations here:
Founding pricing
Start with one market or cover up to five
See what's working — live
Live Intelligence
Watch which trading approaches are currently strongest, how the picture shifts as market conditions change, and when the latest setups appeared — updated every minute.